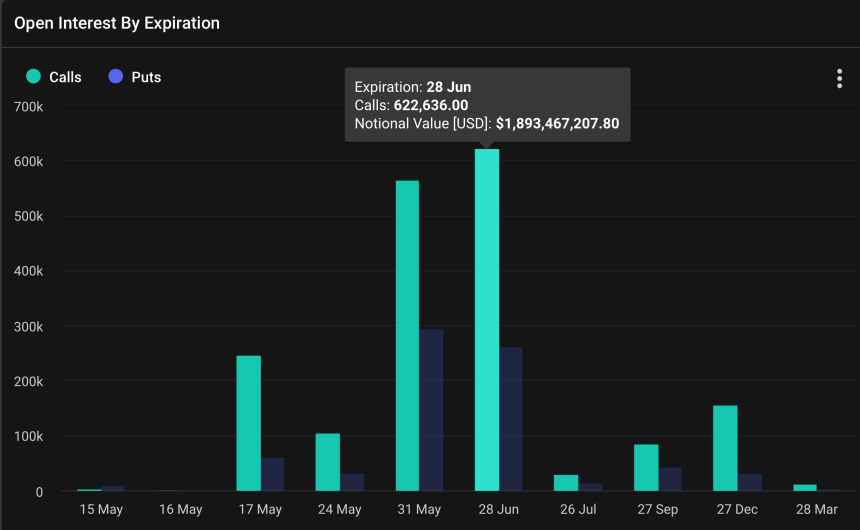
Ethereum (ETH) options for June show a marked interest in higher strike prices, focusing on levels exceeding $3,600.
Data from Deribit reveals a concentrated bet among traders on calls surpassing this price, indicating a bullish sentiment toward Ethereum’s near-term trajectory. The most favored strike price among these optimistic bets is an ambitious $6,500.
Related Reading
Options Market Bullish On Ethereum
Notably, options are contracts that give traders the right, but not the obligation, to buy (in the case of calls) or sell (in the case of puts) the underlying asset at a specified strike price by the expiry date.
A call option is typically purchased by traders who believe the asset will increase in price, allowing them to buy at a lower rate and potentially sell at a higher market price. Conversely, put options are favored by those anticipating a decline in the asset’s price, aiming to sell at the current rate and repurchase at a lower value.
Currently, the Ethereum options market is tilting heavily towards calls, with the aggregate open interest—representing the total number of outstanding contract options—showing a preference for higher strike prices.
This concentration of calls, primarily above the $3,600 mark, suggests that a significant market segment is positioning for Ethereum to ascend to higher levels by the end of June.

According to Deribit data, roughly 622,636 Ethereum call contracts are set to expire by June’s end, encapsulating a notional value above $1.8 billion. Such substantial positioning underscores the market’s confidence in Ethereum’s potential uplift.
Data further shows that the most substantial open interest is clustered around the $6,500 strike price, with a notional value of $193 million.

This concentration reflects trader optimism and supports Ethereum’s market price, especially if these options are exercised as the asset price approaches or surpasses these strike levels.
Despite the optimism embedded in these options, Ethereum is currently navigating a slight downturn. It has dropped 5.4% over the past week and 2.2% in the last 24 hours, positioning it below $2,900. This decline places even more focus on upcoming market catalysts that could significantly sway ETH’s price.
Regulatory Decisions And Technical Indicators: A Dual Influence on ETH’s Path
One significant upcoming event is the US Securities and Exchange Commission’s (SEC) decision on several applications for Ethereum-based Exchange-Traded Funds (ETFs), which is due by May 25th.
This decision is pivotal as approval could usher in a wave of institutional investments into Ethereum, potentially catapulting its price. Conversely, rejection could dampen the bullish sentiment and lead to further pullbacks.
From a technical analysis standpoint, signs are pointing to a possible rebound. The “Bullish Cypher Pattern,” identified by the analyst Titan Of Crypto, suggests that Ethereum could be at a turning point. Currently, Ethereum is at the 38.2% Fibonacci retracement level, a key support zone in many bull markets.
Related Reading
This level has historically acted as a launchpad for upward price movements, hinting that Ethereum could be gearing up for a significant rise.
#Altcoins #Ethereum Bounce incoming.
The Bullish Cypher Pattern played out perfectly and all the targets got reached 🎯.#ETH is currently at the 38.2% Fibonacci retrace level also called “1st stop”. In a bull market this level holds.
I expect a bounce from this level. 🚀 pic.twitter.com/o9e6VLEREz
— Titan of Crypto (@Washigorira) May 12, 2024
Featured image from Unsplash, Chart from TradingView
